Utility bills rarely spike because of one dramatic mistake. More often, they climb quietly, one everyday habit at a time: a TV left on for background noise, a charger that stays plugged in around the clock, water running while dishes are scrubbed, or a thermostat set for comfort without much thought for the monthly bill.
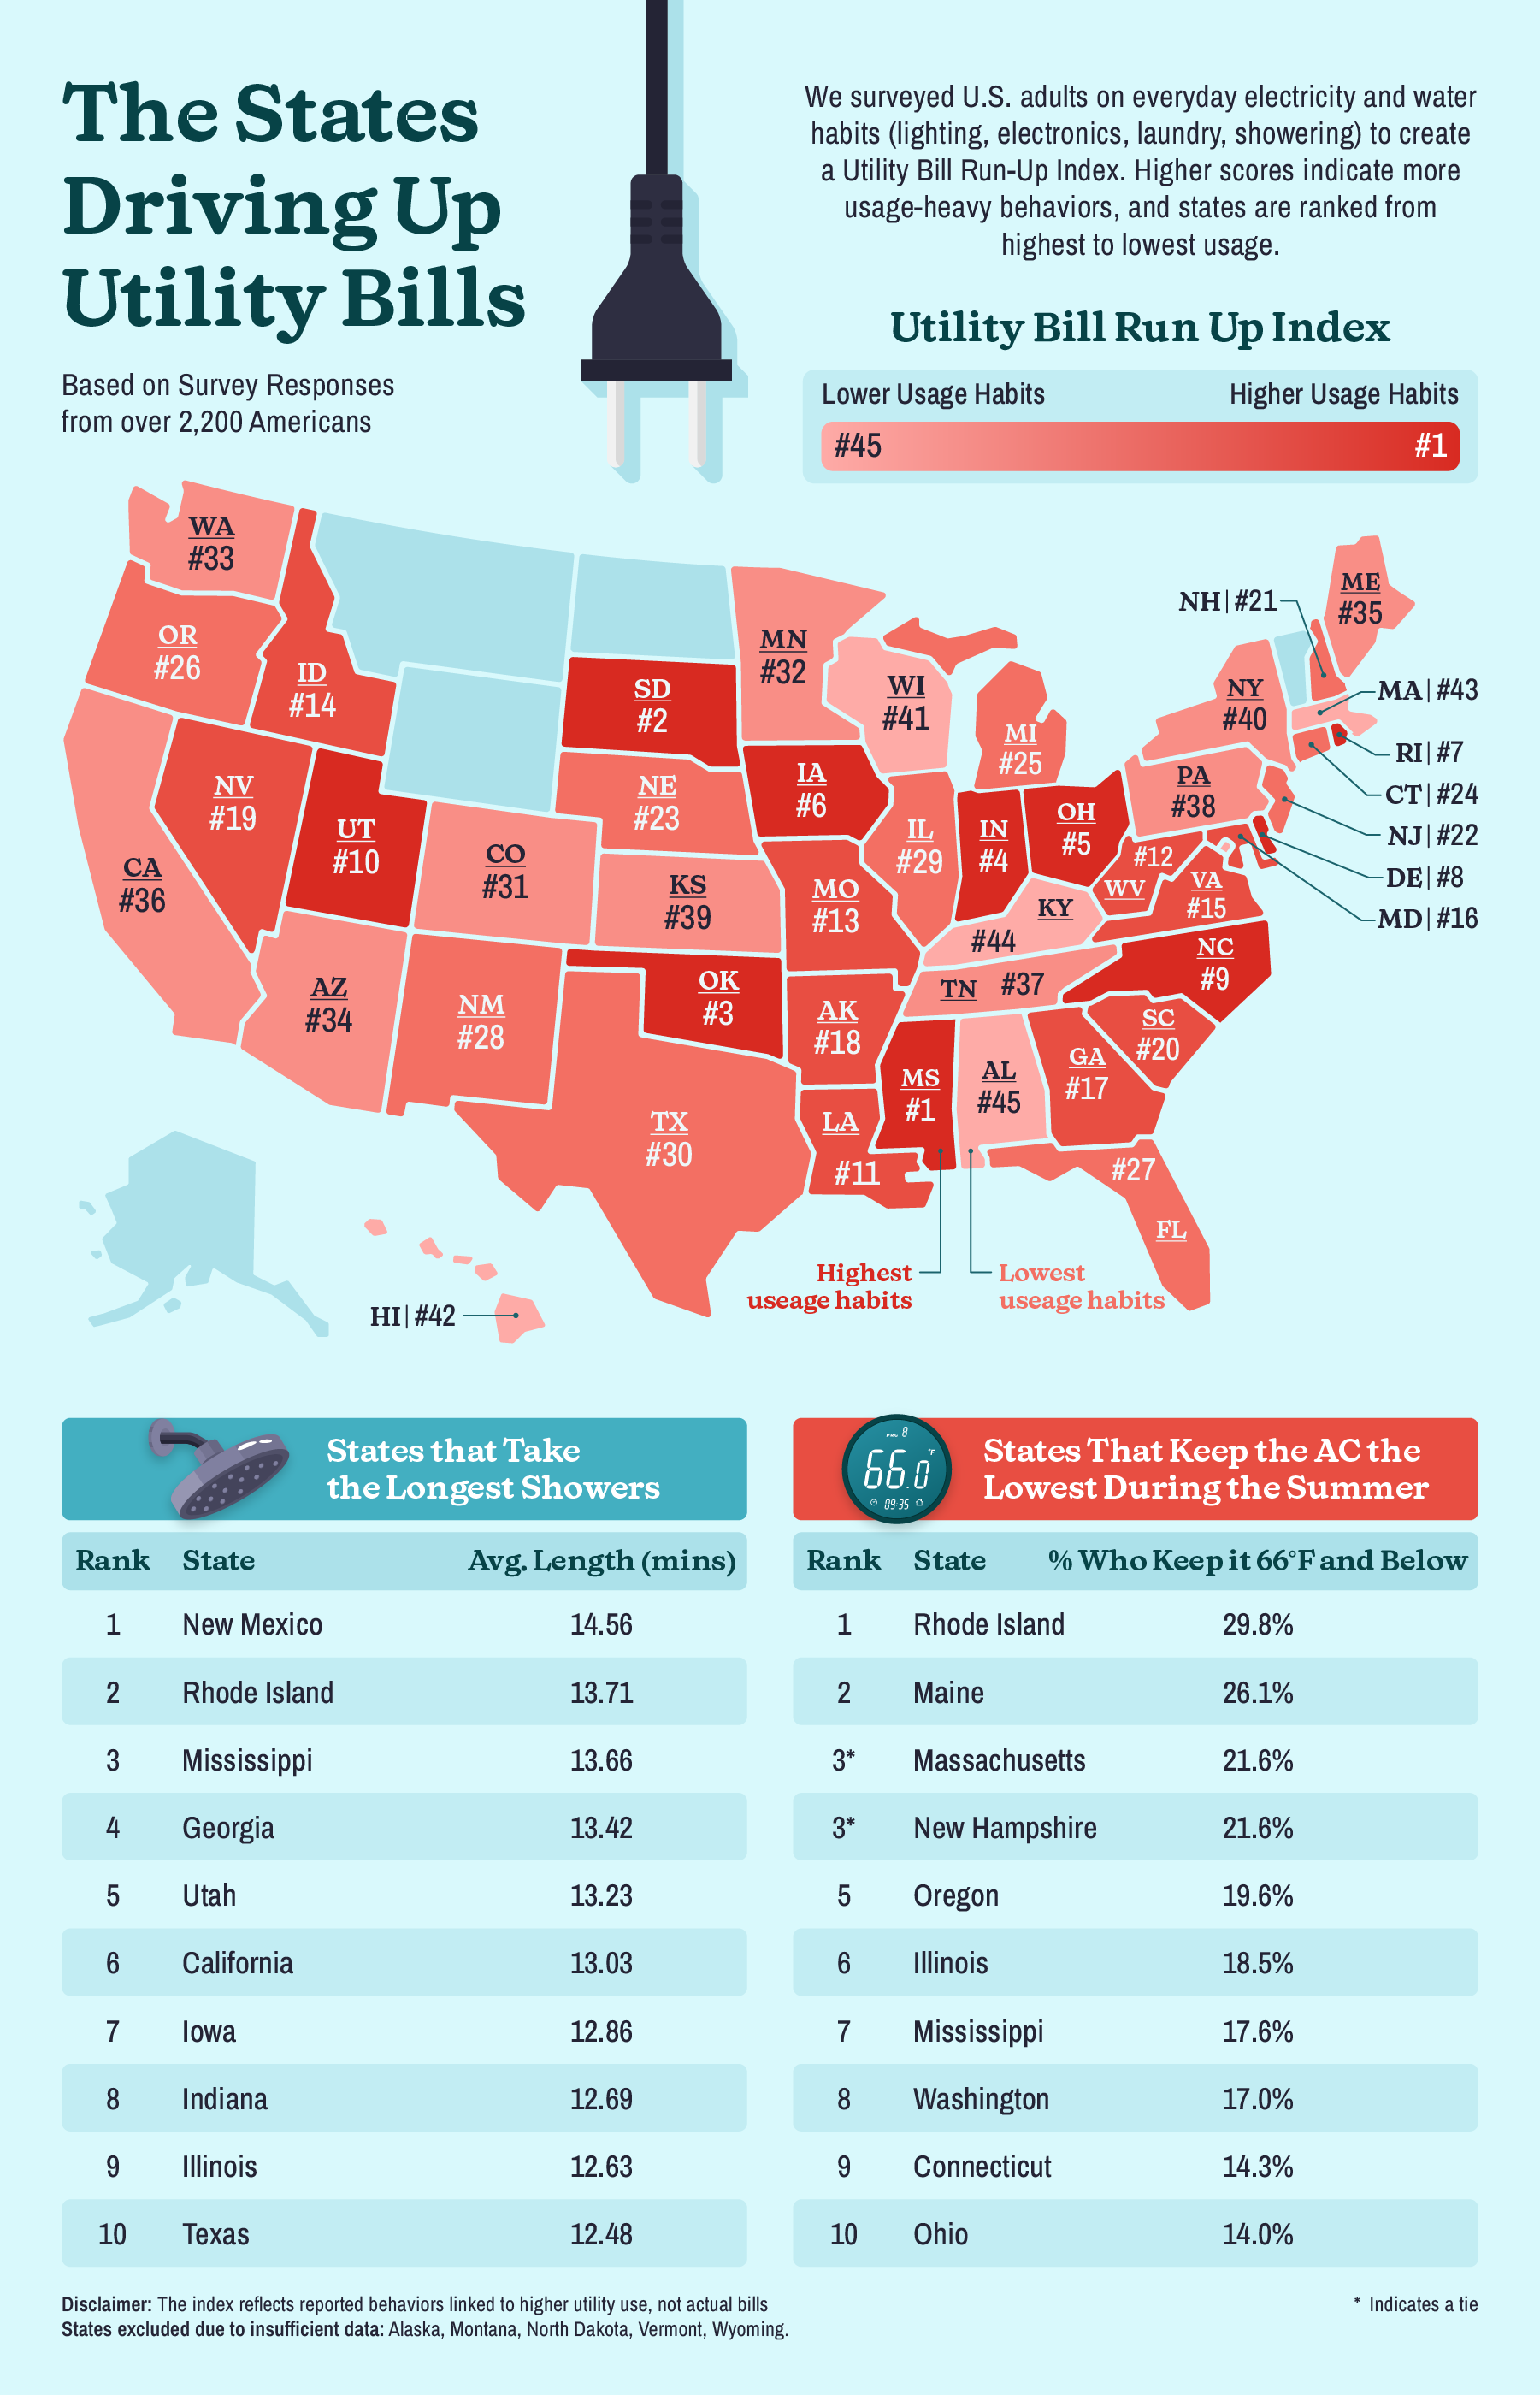
To see where these routines are most common, we surveyed more than 2,200 Americans and built a Utility Bill Run-Up Index based on the electricity and water habits most likely to increase household use. The results show the states most likely to run up utility bills based on where convenience-heavy habits show up most often.
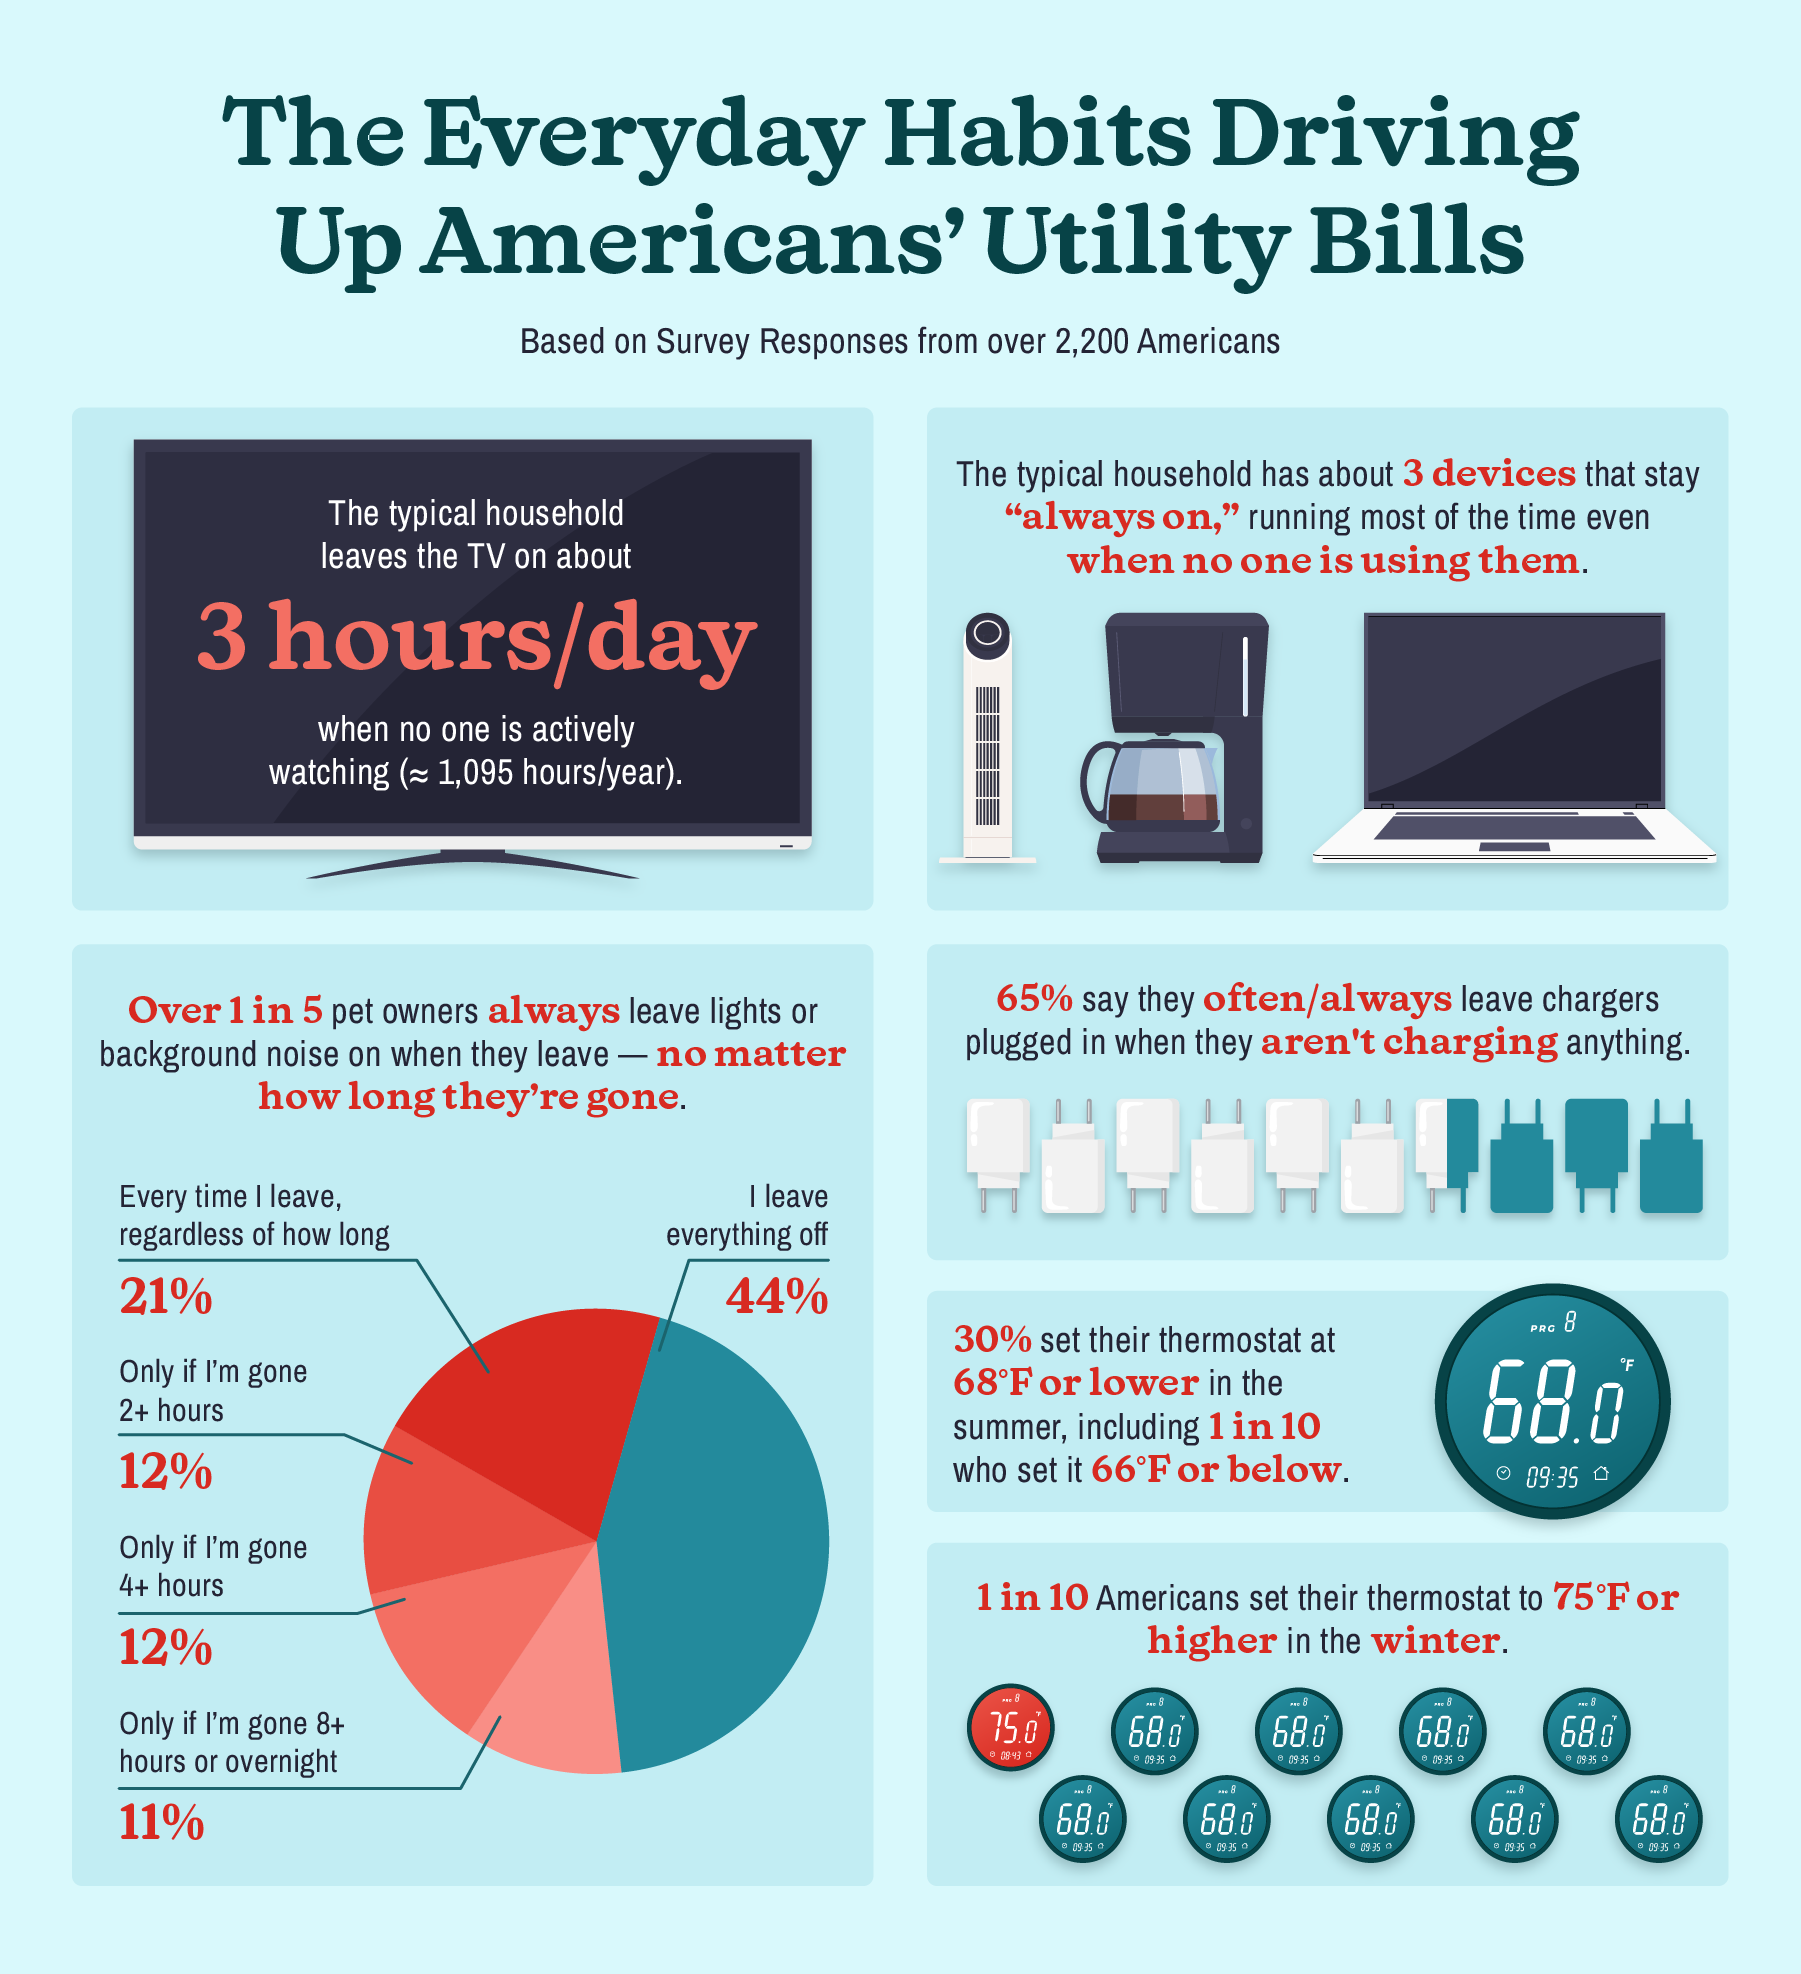
Some of the costliest electricity habits are the ones people barely notice anymore. The typical household leaves the TV on for about 3 hours a day when no one is actively watching, which works out to roughly 1,095 hours a year of background use.
The typical home also has about 3 devices that stay “always on,” running most of the time even when no one is using them. Add in the fact that 65% of Americans say they often or always leave chargers plugged in when they are not charging anything, and it becomes clear how much electricity is being used in the background.
For readers curious about what that usage looks like in real terms, a kWh Calculator can help estimate how much common household devices use and what that may mean for your monthly bill.
Thermostat settings highlight some of the more extreme ends of everyday energy use, even if they’re partly shaped by climate. When asked about their settings during the cooling season (summer), about 30% of Americans said they set their thermostat to 68°F or lower, including 1 in 10 who go as low as 66°F or below. During the heating season (winter), 1 in 10 reported setting their thermostat to 75°F or higher. These more aggressive settings may not seem significant day to day, but over time they can meaningfully increase household energy use.
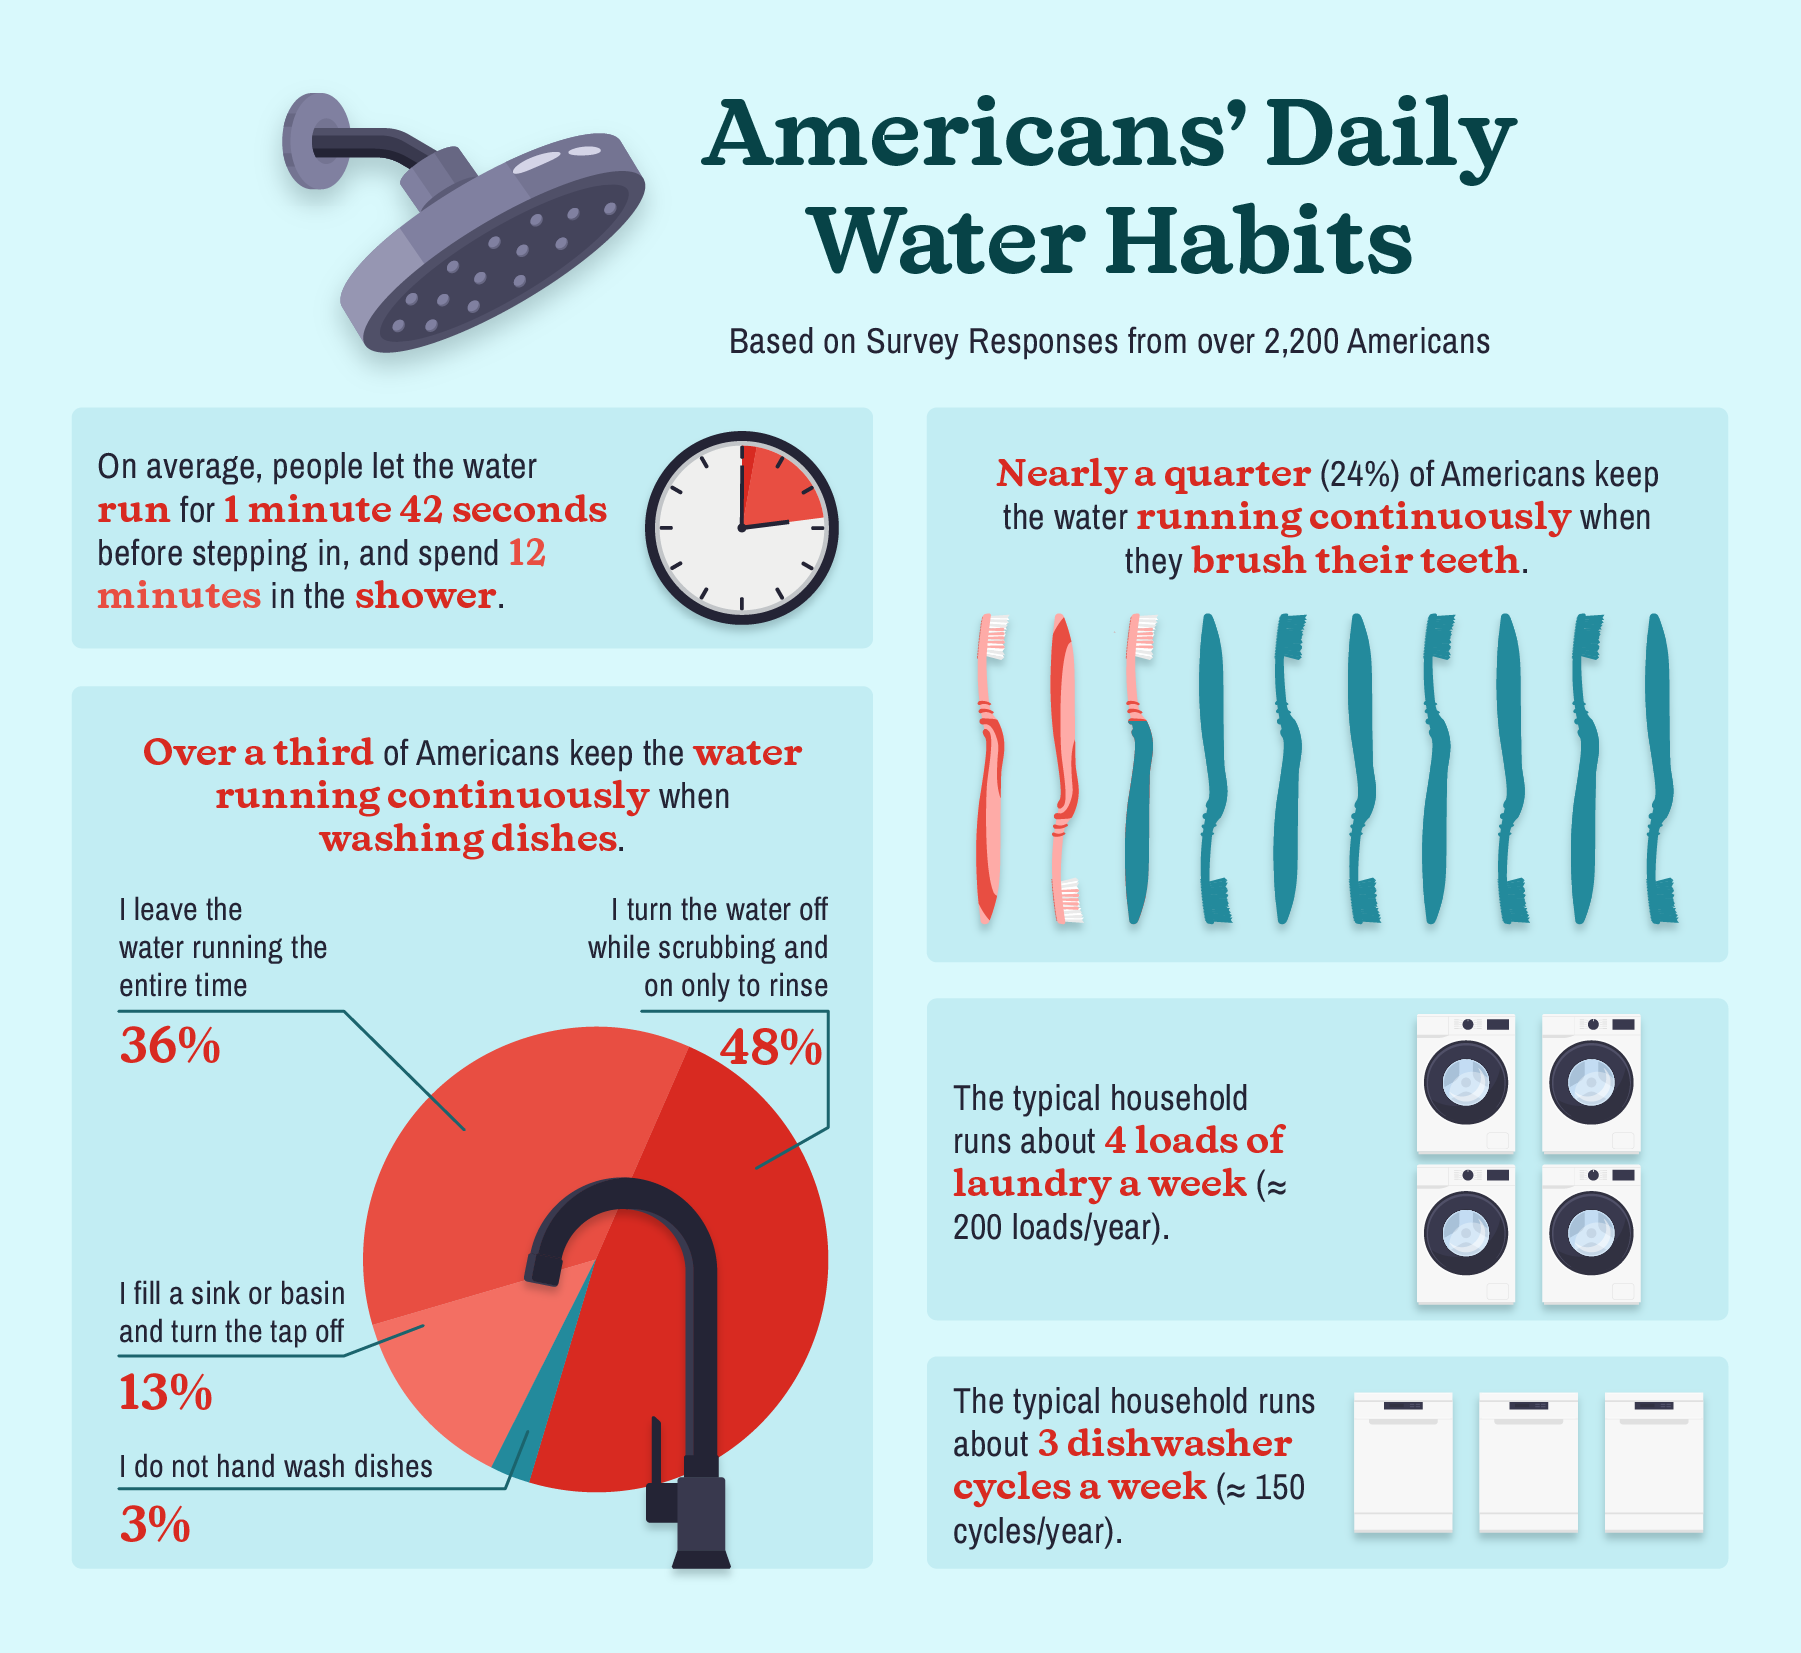
Electricity tends to get more attention, but water habits are a major part of how households run up utility costs too, especially when hot water is involved. On average, Americans let the shower run for 1 minute and 42 seconds before stepping in, then spend another 12 minutes in the shower itself.
More than a third keep the water running continuously while washing dishes, and nearly a quarter do the same while brushing their teeth. The typical household also runs about 4 loads of laundry a week and about 3 dishwasher cycles.
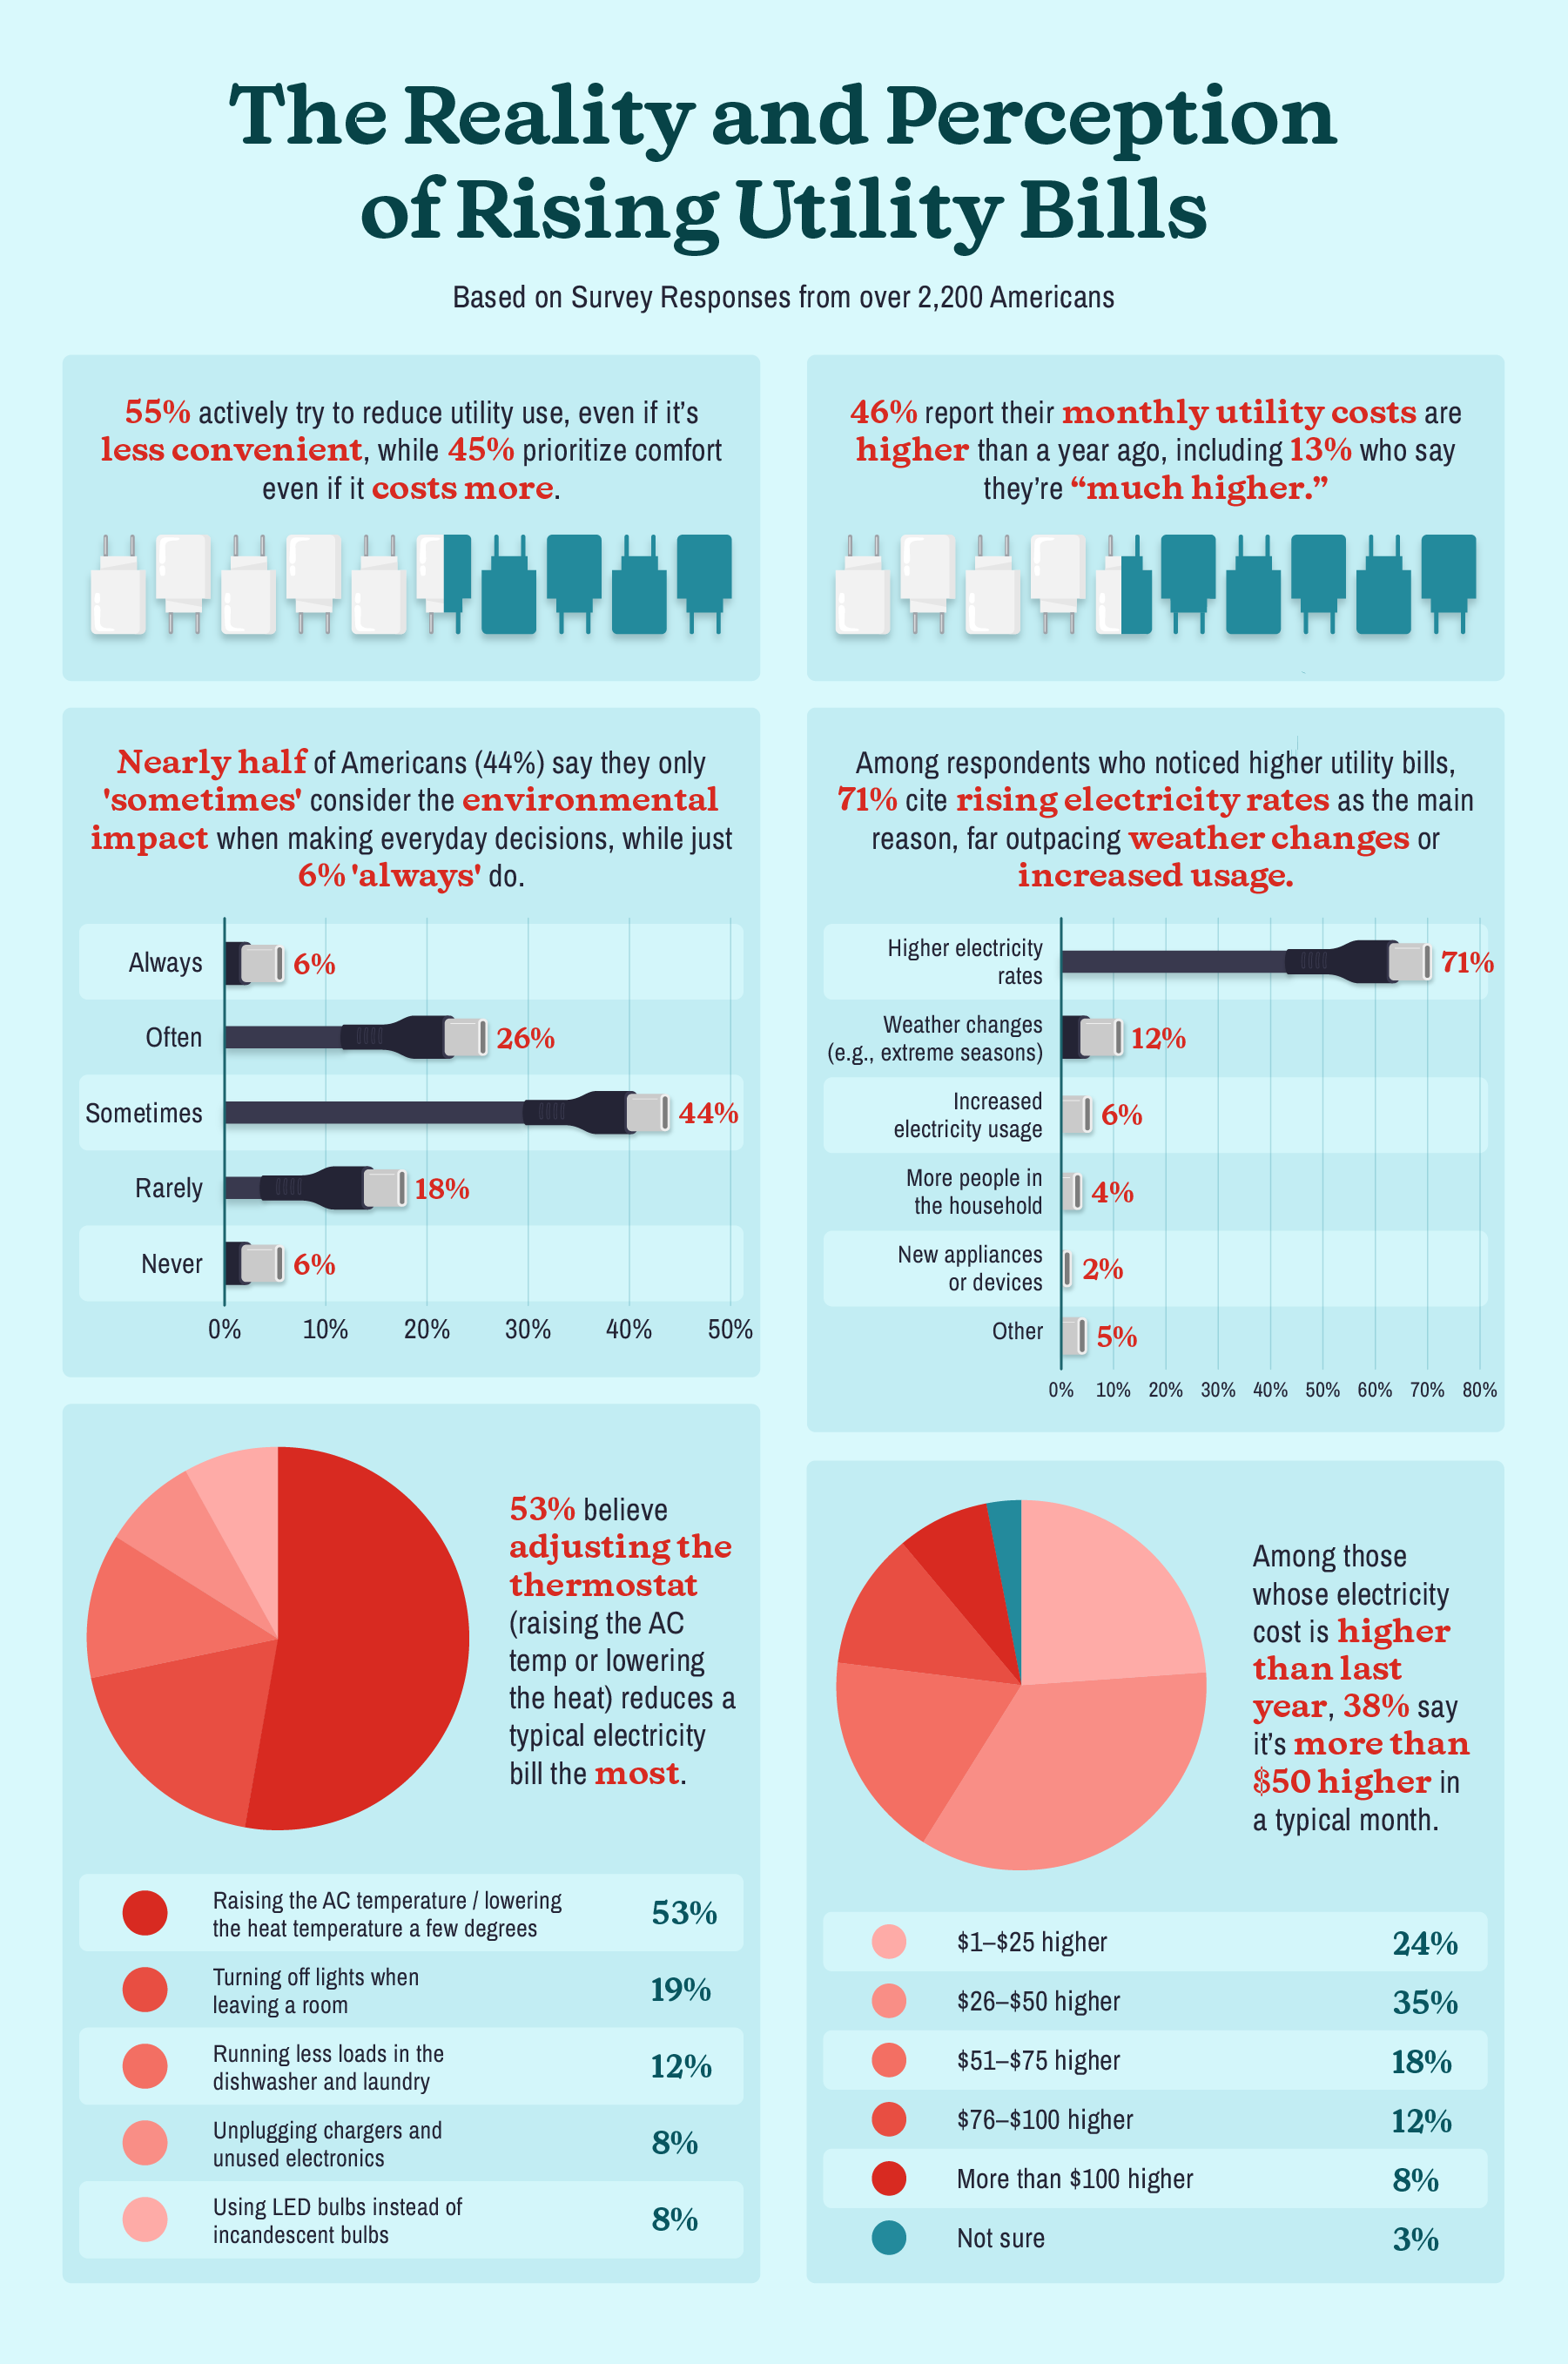
Americans are clearly feeling the pressure of higher utility costs. Nearly half (46%) say their monthly utility bills are higher than they were a year ago, including 13% who say they are “much higher.” And for many households, the increase is not small: among those whose electricity costs have gone up, 38% say they are paying more than $50 extra in a typical month.
When asked what is driving those increases, most respondents point to forces outside their control. Among those who noticed higher electricity bills, 71% say rising electricity rates are the main reason, far outpacing weather changes or increased household usage. That helps explain why so many Americans feel squeezed, even when they are trying to be more mindful at home.
Still, the survey shows that daily comfort often wins out over cutting costs. A slim majority of Americans (55%) say they actively try to reduce utility use even if it is less convenient, while 45% say they would rather be comfortable even if their bill costs more.
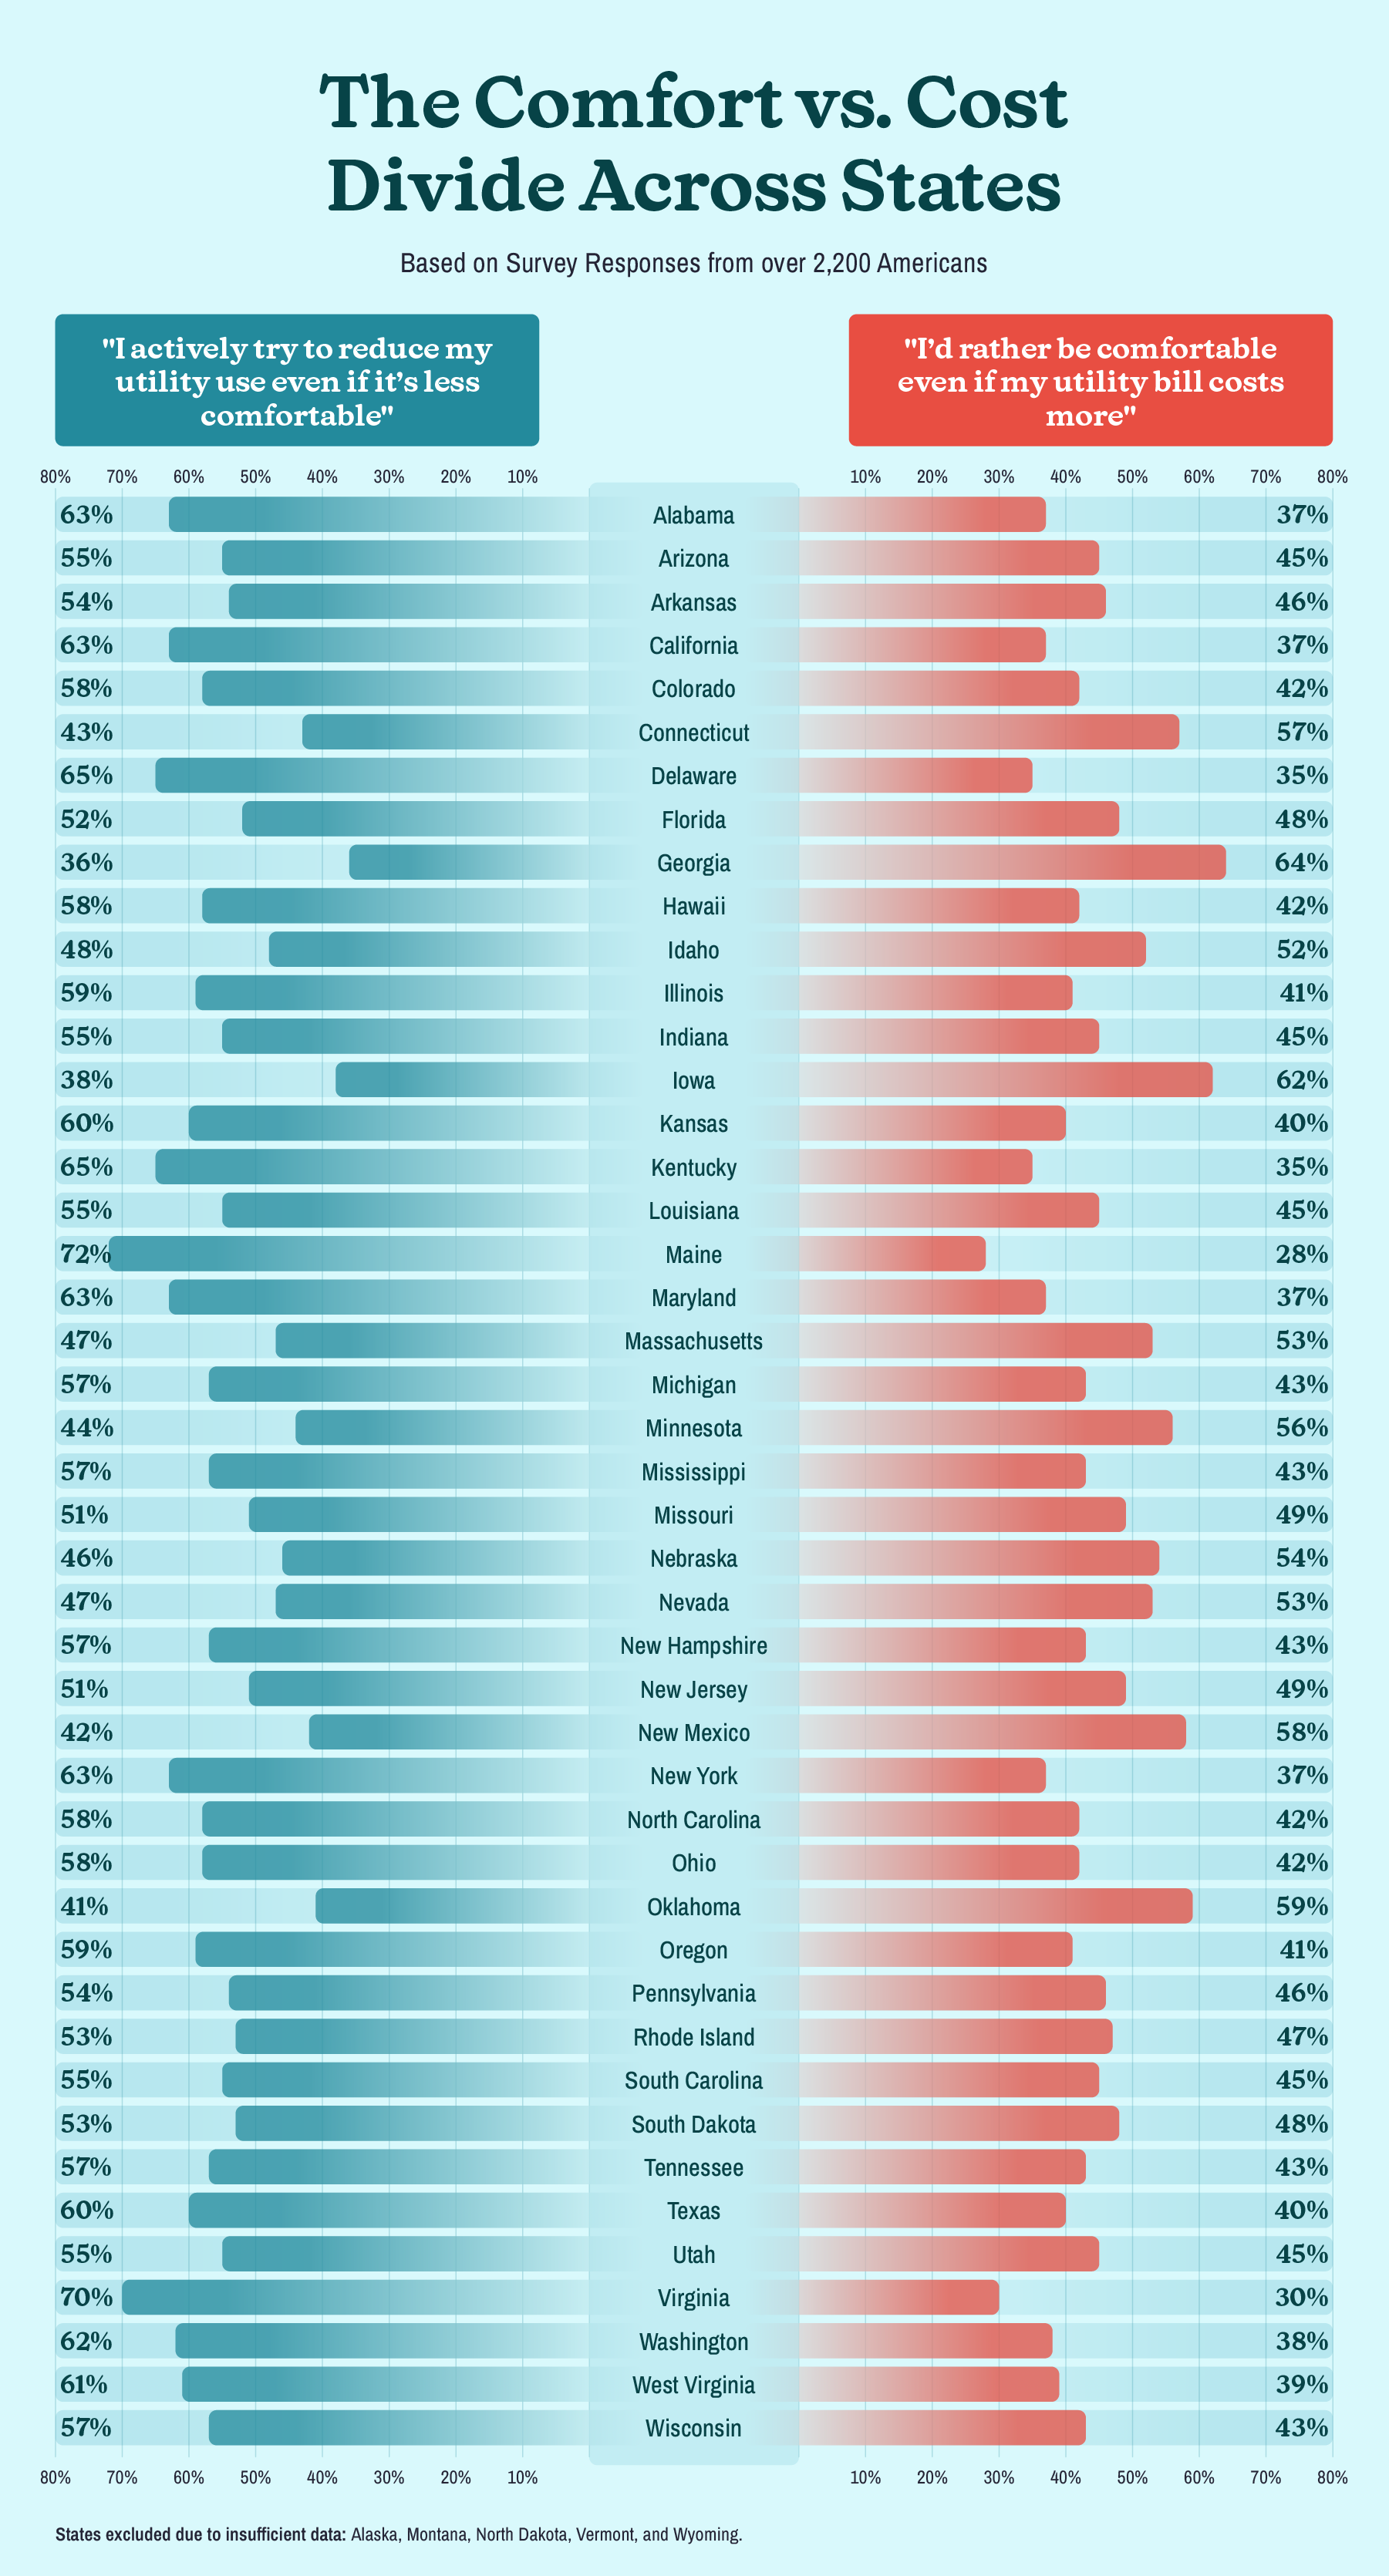
One of the most revealing patterns in the survey is how sharply attitudes vary by state. Maine had the highest share of respondents who said they actively try to reduce utility use even if it is a little less comfortable, at 72%. Virginia followed at 70%, with Kentucky (65%) and Delaware (65%) not far behind. These states leaned more heavily toward saving than comfort, at least in how respondents described their approach.
On the other side of the divide, Georgia stood out as the most comfort-first state in the survey, with 64% saying they would rather be comfortable even if their utility bill costs more. Iowa followed at 62, then Oklahoma (59%), New Mexico (58%), and Connecticut (57%). That mindset does not explain every result on its own, but it helps make sense of why some high-use habits persist even when costs are rising.
Climate matters. Housing type matters. Utility rates matter. But attitude matters too. When comfort becomes the default setting, households may be more willing to leave the AC lower, ignore always-on electronics, or let the thermostat stay put when no one is home. And when savings become the priority, people may be more willing to make the small adjustments that add up over time.
Texas landed in the lower half of the pack on the Utility Bill Run-Up Index, ranking No. 30 overall out of the 45 states included in the analysis. On the electricity side, Texans appeared more mindful than the national average in several key ways:
At the same time, Texas also showed a few habits that can quietly push utility use higher:
Thermostat responses in Texas also reflected the state’s climate and comfort patterns:
With 34% of Texans saying their household utility costs are higher than they were a year ago, small adjustments like changing the thermostat when no one is home, cutting back on always-on devices, and reducing hot water waste can still add up over time.
If there is one encouraging takeaway from the survey, it is that many of the habits driving bills higher are also the easiest ones to adjust. Here are some tips to help your bill:
The biggest takeaway from this survey is that utility bills are often shaped by routine more than people realize. It is usually not one oversized mistake driving costs up. It is the pileup of ordinary decisions: the longer shower, the plugged-in charger, the background TV, the thermostat that never changes when the house is empty.
In places where residents can shop for electricity plans, finding a better rate can make a difference. But so can shortening shower warm-up time, unplugging idle devices, turning off background electronics, and giving the thermostat a little more breathing room. When costs are already rising, those quiet adjustments matter more than ever.
Power Wizard surveyed 2,260 U.S. adults online from Feb. 24 through Mar. 10, 2026. The survey measured self-reported everyday habits linked to higher electricity and water use across lighting, electronics, heating and cooling, dishwashing, laundry, and showering.
We created a 0-to-100 Utility Bill Run-Up Index by standardizing each behavior into a comparable score. Frequency-based responses were mapped to a 0-to-100 scale, ordered categorical answers were scored by intensity, and numeric responses were scaled using 5th-to-95th percentile bounds to limit the effect of outliers. “Not sure” and “Not applicable” responses were excluded for that item, and household-total measures like laundry and dishwasher use were converted to per-person rates.
The final ranking equally weighted two components: an Electricity Habits Index based on 10 behaviors and a Water Habits Index based on 8 behaviors. State scores reflect the average reported behavior of respondents in each state. This index reflects behaviors associated with higher utility use, not actual utility bills or utility rates. Alaska, Montana, North Dakota, Vermont, and Wyoming were excluded due to insufficient data.
You are welcome to use, reference, and share non-commercial excerpts of this study with proper attribution. If you cite or cover our findings, please link back to this page so readers can view the full methodology, charts, and context.
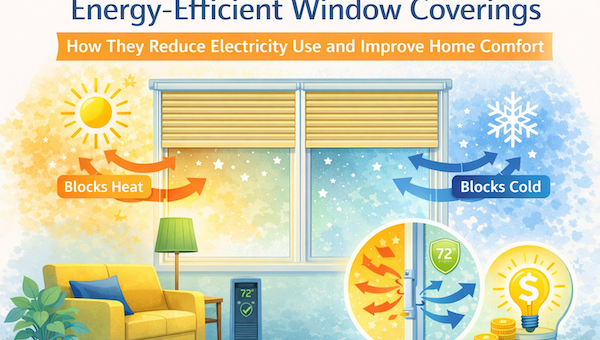
Windows can be a major source of energy loss in homes that rely on electric heating and cooling....
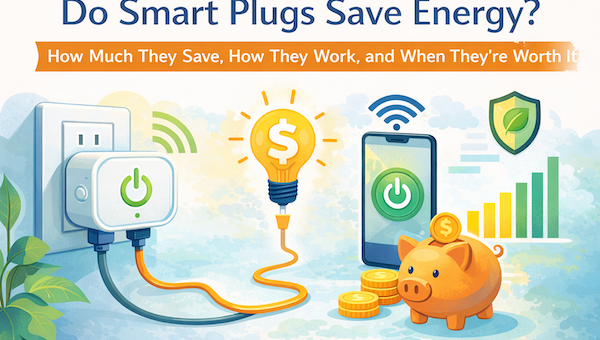
Smart plugs are often marketed as an easy way to save energy, but the way they actually help is widely misunderstood....
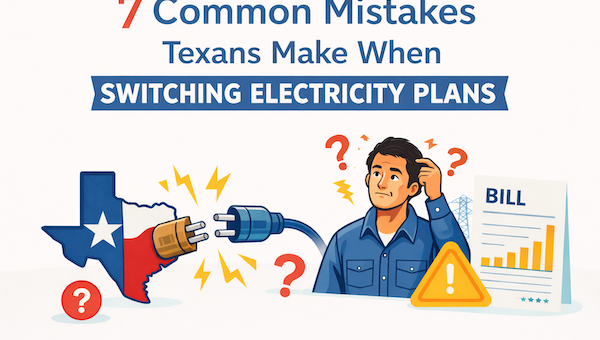
On paper, having dozens of plans to choose from sounds like a good thing. In practice, it creates a lot of noise....