
With record-breaking temperatures frequently hitting the triple digits, it’s clear that air conditioning isn’t a luxury but a necessity. While Texans across the state rely on it to stay comfortable during the summer, the financial burden of keeping cool varies significantly from one city to the next.
To understand where keeping cool hits the hardest across our Lone Star State, we compared average residential electricity bills during the summer months with median household income across Texas cities. Our ranking shows where Texans are devoting the highest share of their income to beating the heat.
Key Findings
- Brownsville had the highest summer electricity burden in our 50-city analysis at 5.67%.
- Harlingen followed closely at 5.60%.
- Six of the seven highest-burden cities were in the Rio Grande Valley.
- New Braunfels had the lowest burden at 2.33%.
- Six of the ten lowest-burden cities were in the Dallas–Fort Worth area.
- Brownsville’s burden was 3.34 percentage points higher than New Braunfels’ and approximately 143% higher relative to New Braunfels’ burden.
What Is Summer Electricity Burden?
We define summer electricity burden as the average residential electricity bill during June, July, and August divided by estimated median monthly household income.
This percentage helps us compare electricity affordability across communities with different income levels.
For example, two cities may have similar average electricity bills but very different burdens if their household incomes differ substantially. Likewise, a city can have a higher bill in dollars but a lower electricity burden when its estimated median household income is also higher.
Summer electricity burden is an affordability measure. It does not represent the percentage of income that every household actually spends, and it is not a direct measure of air-conditioning-only expenses.
Where Texans Spend The Largest Share Of Income On Summer Electricity
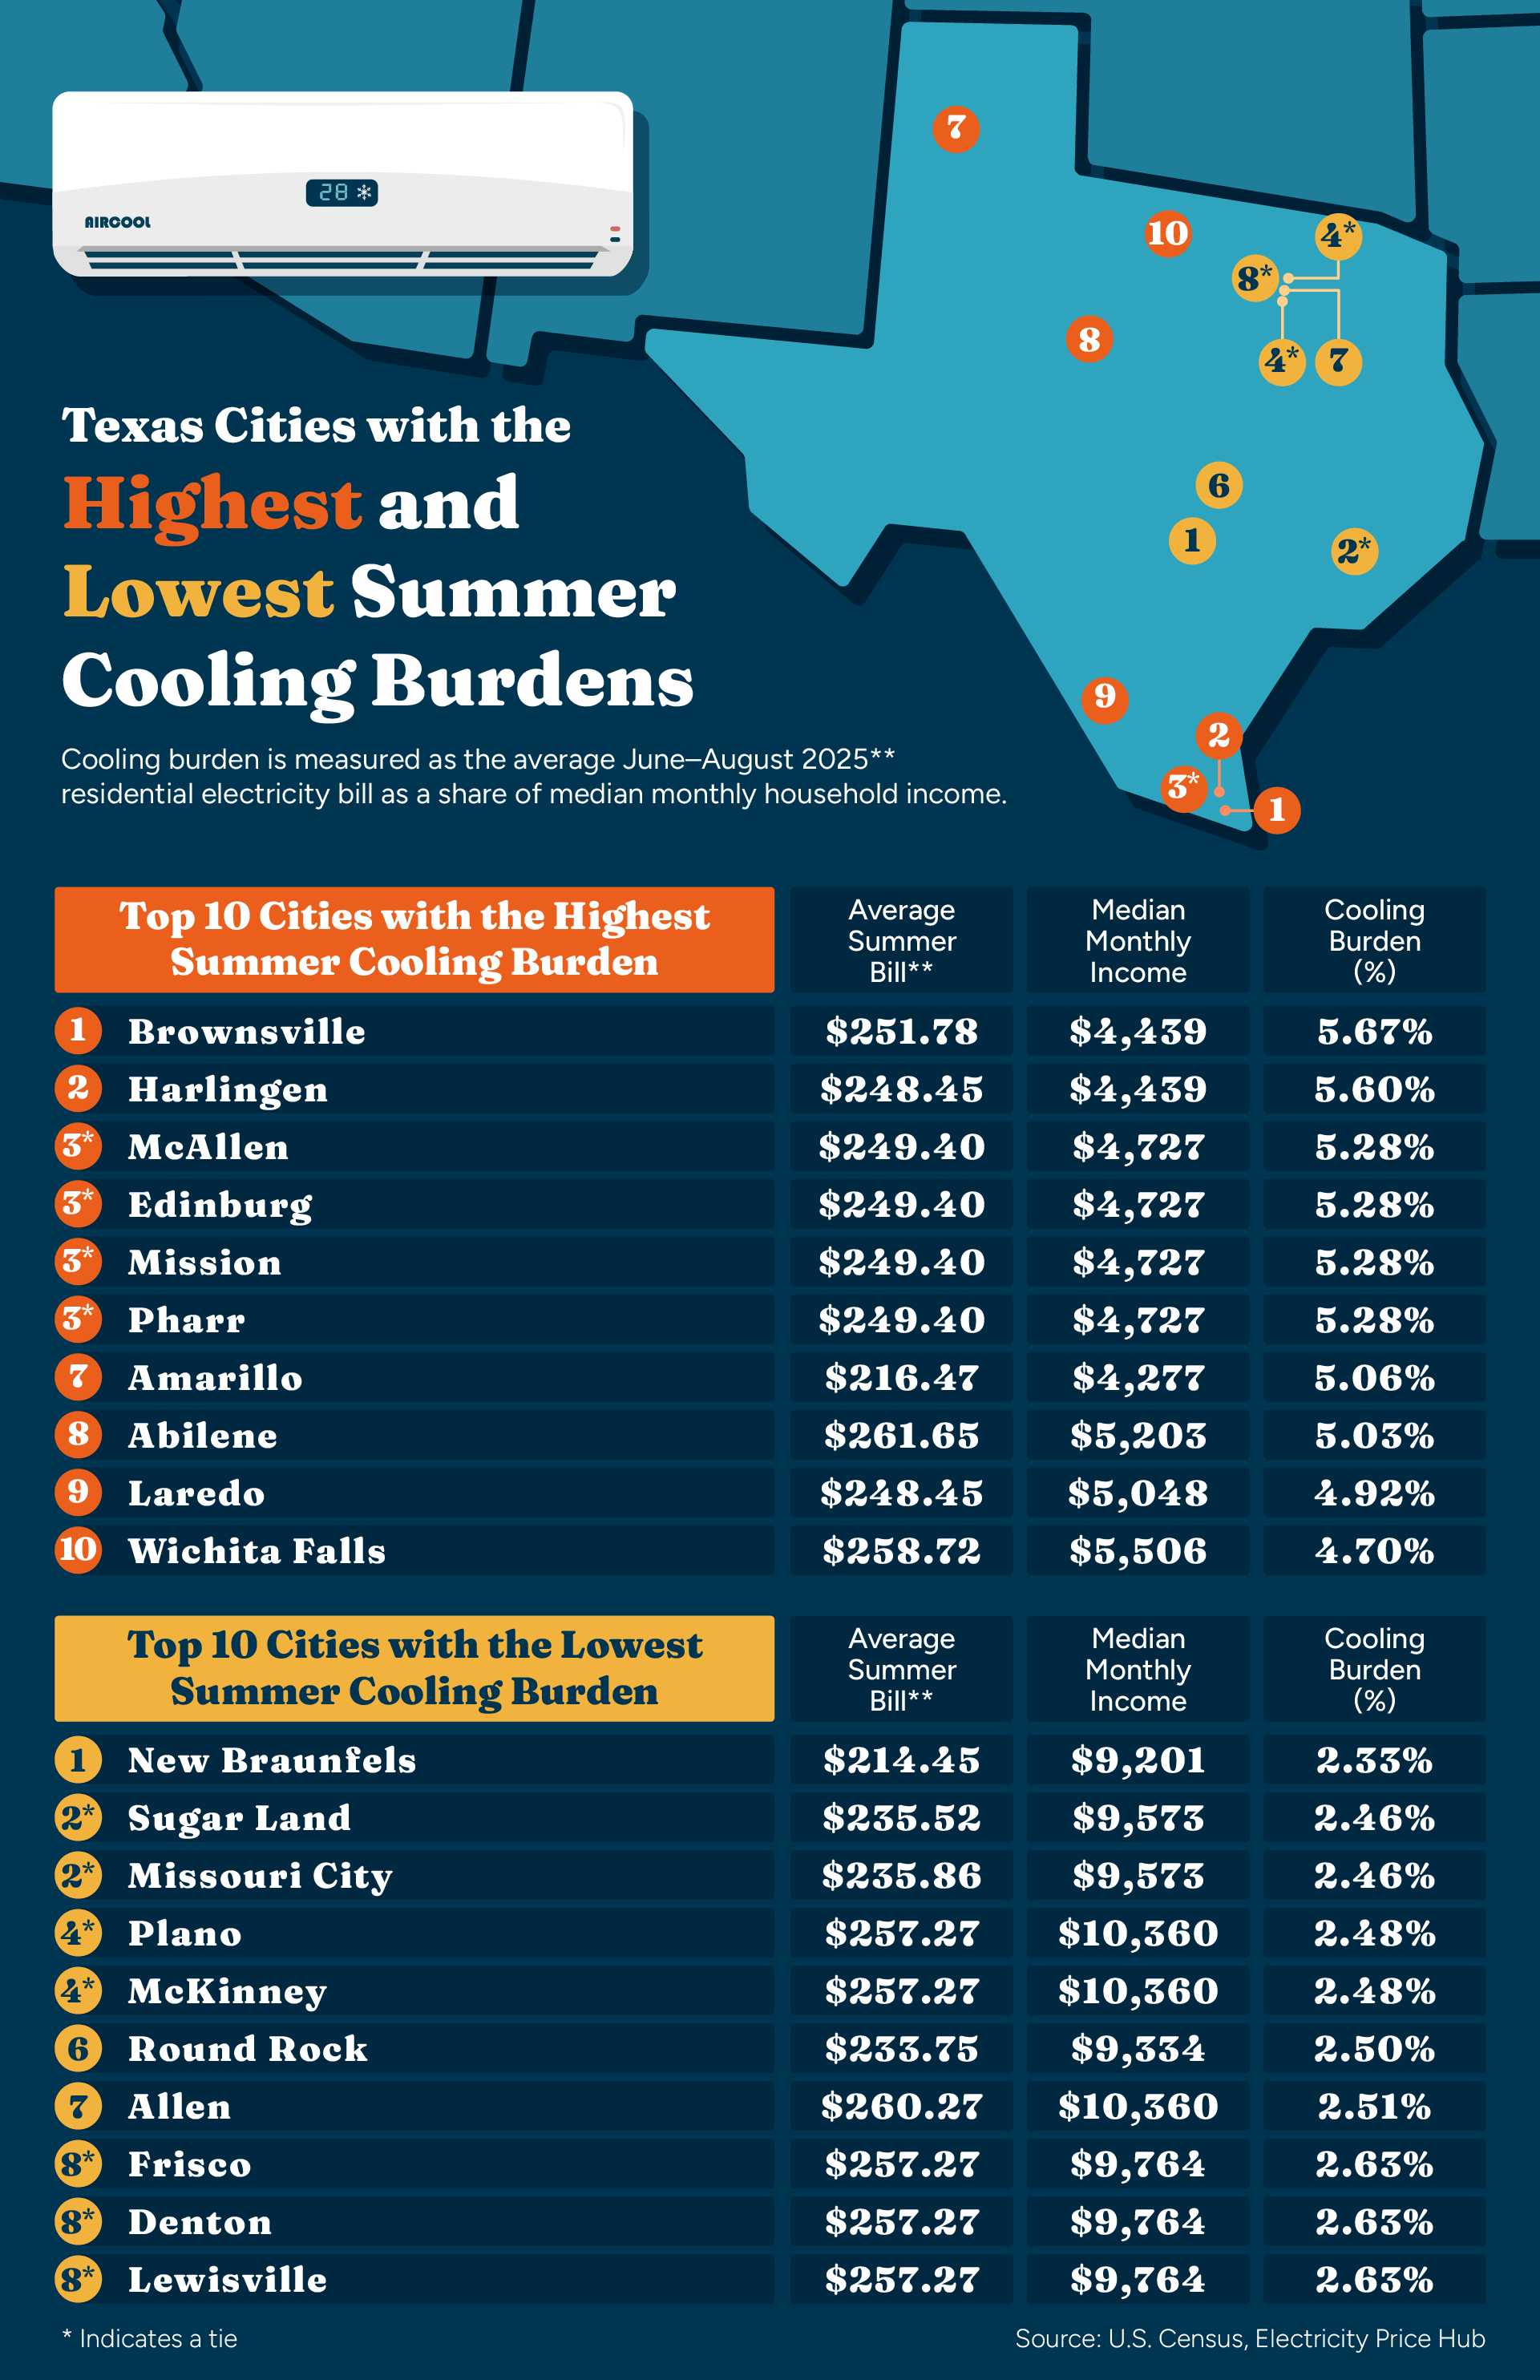
Not all Texans feel the weight of summer heat equally. Our analysis found residents in some cities spend more than twice the share of their monthly income on summer electricity bills than those in the state’s most affordable communities.
Texas Cities With The Highest Summer Electricity Burden
The following cities had the highest summer electricity burdens in our analysis:
- Brownsville — 5.67%
- Harlingen — 5.60%
- McAllen — 5.28% (tie)
- Edinburg — 5.28% (tie)
- Mission — 5.28% (tie)
- Pharr — 5.28% (tie)
- Amarillo — 5.06%
- Abilene — 5.03%
- Laredo — 4.92%
- Wichita Falls — 4.70%
The Rio Grande Valley accounted for six of the seven highest-burden cities in our analysis. Brownsville ranked highest at 5.67%, followed by Harlingen at 5.60%. McAllen, Edinburg, Mission, and Pharr each had a summer electricity burden of 5.28%.
Every city in the highest-burden group had an average summer electricity bill equal to at least 4.70% of estimated median monthly household income. This is not simply a ranking of cities with the highest electricity bills in dollar terms.
Summer electricity burden considers the relationship between bills and income. A city may have a lower average bill but a higher burden when its estimated median household income is also lower. That distinction helps show where summer electricity costs may place the greatest pressure on household budgets.
Texas Cities With The Lowest Summer Electricity Burden
The following cities had the lowest summer electricity burdens in our analysis:
- New Braunfels — 2.33%
- Sugar Land — 2.46% (tie)
- Missouri City — 2.46% (tie)
- Plano — 2.48% (tie)
- McKinney — 2.48% (tie)
- Round Rock — 2.50%
- Allen — 2.51%
- Frisco — 2.63% (tie)
- Denton — 2.63% (tie)
- Lewisville — 2.63% (tie)
New Braunfels had the lowest summer electricity burden in our analysis at 2.33%. Sugar Land and Missouri City tied at 2.46%, while Plano and McKinney tied at 2.48%.
Six of the ten lowest-burden cities were in the Dallas–Fort Worth area:
- Plano
- McKinney
- Allen
- Frisco
- Denton
- Lewisville
The cities with the lowest burdens did not necessarily have the lowest electricity bills in dollar terms. In many cases, higher estimated household incomes reduced the percentage of income represented by the average bill. This reinforces why electricity affordability cannot be evaluated using bill amounts alone.
Explore Summer Electricity Burden Across Texas
Not every city appeared in the highest or lowest ten. Use our interactive chart to explore summer electricity burden across all 50 Texas cities included in our analysis.
How Texans Can Better Manage Summer Electricity Costs
Households cannot control the Texas heat, but they can review how electricity usage and plan structure affect their monthly bills.
Understand what is included in your electricity bill
Start by reviewing your monthly kilowatt-hour usage and the individual charges on your bill. Depending on the plan, these may include:
- Energy charges
- Utility delivery charges
- Monthly base fees
- Minimum-usage fees
- Bill or usage credits
- Taxes and other assessments
Our guide to how to read your Texas electricity bill can help you identify these charges and understand how they affect your total cost.
Compare electricity plans using realistic usage
An advertised electricity rate does not always show what a household will actually pay. Electricity costs may change depending on whether a household uses 500, 1,000, 2,000 or any other amount of kilowatt-hours during a billing period. That makes it important to compare plans using expected summer electricity consumption rather than relying only on one advertised rate.
Review the Electricity Facts Label
The Electricity Facts Label, or EFL, explains the pricing structure and important terms of a Texas electricity plan. Before selecting or renewing a plan, review the EFL for:
- Energy charges
- Delivery charges
- Base fees
- Usage-based credits
- Minimum-usage requirements
- Contract length
- Early-termination fees
- Renewable-energy content
Our Electricity Facts Label guide explains how to evaluate these details before choosing or renewing a plan.
Look for ways to reduce avoidable electricity use
Depending on the home and household, maintaining the HVAC system, replacing dirty filters, sealing air leaks, using ceiling fans while rooms are occupied, and closing blinds during periods of direct sunlight may help reduce summer electricity use.
Our guide to ways to save electricity at home includes additional strategies.
What Our Findings Mean For Texas Households
Our analysis shows that summer electricity affordability varies substantially across Texas. Among the 50 cities we studied, the average summer electricity bill represented between 2.33% and 5.67% of estimated median monthly household income.
That gap is not explained by electricity-bill amounts alone. Some cities with relatively high bills had lower burdens because estimated household incomes were also higher. Other cities faced a greater burden even when their average bills were not the highest in our analysis.
Understanding the relationship between electricity bills and income can help consumers, journalists, researchers, and policymakers evaluate electricity affordability more clearly. For individual households, electricity usage and plan structure remain important.
Reviewing the current bill, understanding the Electricity Facts Label, and comparing plans at realistic usage levels can help Texans make more informed decisions. We help Texans compare electricity plans available in their area so they can evaluate their options based on location, expected usage, budget, and plan terms.
Methodology
Power Wizard ranked 50 selected Texas cities using a county-based measure of summer electricity burden. Each city was matched with an associated Texas county. For each entry, we calculated summer electricity burden by dividing the county’s average residential electricity bill for June, July, and August 2025 by the county’s estimated median monthly household income.
Electricity-bill data came from Electricity Price Hub. Household-income data came from the U.S. Census Bureau’s 2020–2024 estimates. Where the Census source reported annual median household income, the annual figure was divided by 12 to produce an estimated monthly amount.
The 50 cities were selected to represent major population centers, metropolitan areas, border communities, coastal markets, fast-growing suburbs, and regional hubs across Texas. The rankings are presented by city for geographic accessibility, but the underlying electricity and income inputs are county-level. Cities associated with the same county may therefore share underlying values and should not be treated as independent city-level measurements.
This measure is intended as a comparative affordability indicator. It does not represent the actual percentage of income spent by every household, does not account for differences among individual homes or electricity plans, and does not isolate air-conditioning expenses from other residential electricity use.
Fair Use
You are welcome to use, reference, and share non-commercial excerpts of this study with proper attribution. If you cite or cover our findings, please link back to this page so readers can view the full methodology, charts, and context.
Table of Contents
Related Articles
-
 August 4, 2026
Early Termination Fees
An Early Termination Fee (ETF) is a disclosed charge that may apply if you end an electricity plan before the contract e...
-
 April 14, 2026
Fan vs. Air Conditioner Electricity Usage in Texas: Cost, Energy & Savings Compared
When Texas heat hits, staying cool can feel like a battle between comfort and cost. Should you rely on ceiling and box f...
-
 April 6, 2026
Time-of-Use vs. Prepaid Electricity Plans in Texas
Prepaid and time-of-use (TOU) electricity plans take two very different approaches to rates and plan structure. Each can...